21 lines
495 B
Markdown
21 lines
495 B
Markdown
# A simple script to plot SRG/ART-XC L2 monitor light-curve
|
|
|
|
## step 1
|
|
|
|
install script
|
|
|
|
```
|
|
git clone http://heagit.cosmos.ru/artxc/monitor.git
|
|
```
|
|
|
|
## step 2
|
|
|
|
Dwnload SRG/ART-XC monitor CSV file from https://monitor.srg.cosmos.ru/
|
|
|
|
## step 3
|
|
|
|
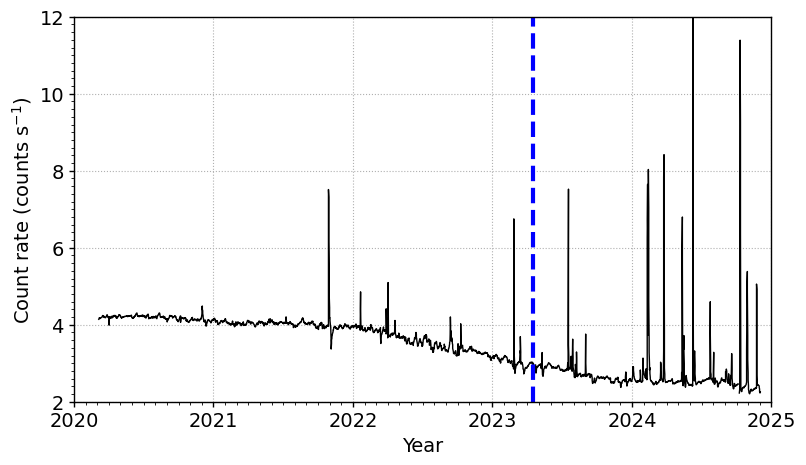
insert filename to plot.py and run ```python plot.py```. Result will be saved to ```monitor.png``` as shown below:
|
|
|
|
|
|
|
|
Vertical dashed line shows a time of interested event. |